
Crude Oil WTI Trading Strategy: Best Crude Oil Trading Strategies
Unlike many other markets, if you want to have a better reading of
the Oil price action, you also need to be interested in the fundamental
side.
The Oil supply and demand balances are a critical factor that can alter and change the Oil trend.
In this regard, keeping an eye on the Oil output forecast and consumption outlook can give you an extra edge.
The Oil market is also very sensitive to geopolitical risks.
Keep this in mind when deciding to trade Brent Crude or WTI Crude.
Everything that happens in Iran, or anything that happens in terms of weather in the Gulf of Mexico, will adversely affect the Oil supply output.
Another trading tip is that Oil prices are sensitive to the seasonal pattern. If you get into the seasonal flow of trading Oil, it can be quite rewarding.
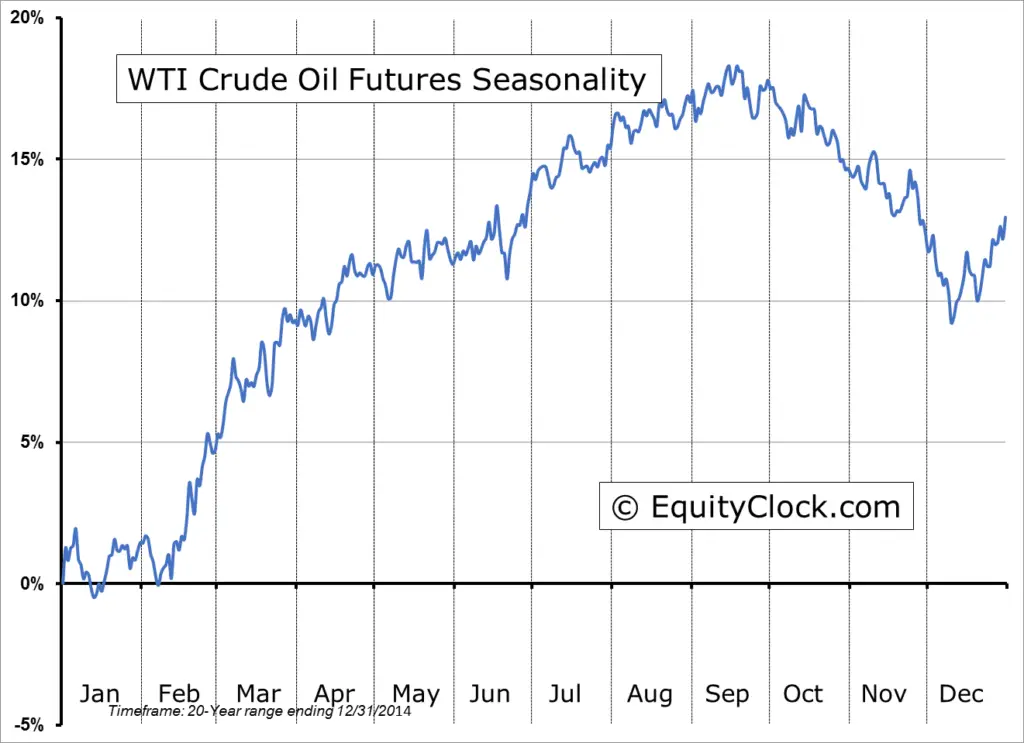
The Crude Oil price has the tendency to rise in August due to the summer driving season. It tends to fall towards mid-September and October.
Weather and climate affect changes in oil prices much more than they affect securities such as stocks and bonds.
When there is an unusually cold winter, demand for oil (used for heating) will increase.
Spring and Fall typically see the lowest petroleum values. For cyclical traders, this is often the best opportunity to enter the market.
Crude Oil Price vs the US Dollar
The strength of the dollar is a quick way to gauge the strength of Crude Oil prices.
As a general rule, crude oil prices tend to drop when the US dollar appreciates. Conversely, when the dollar is weaker, crude oil prices tend to strengthen.
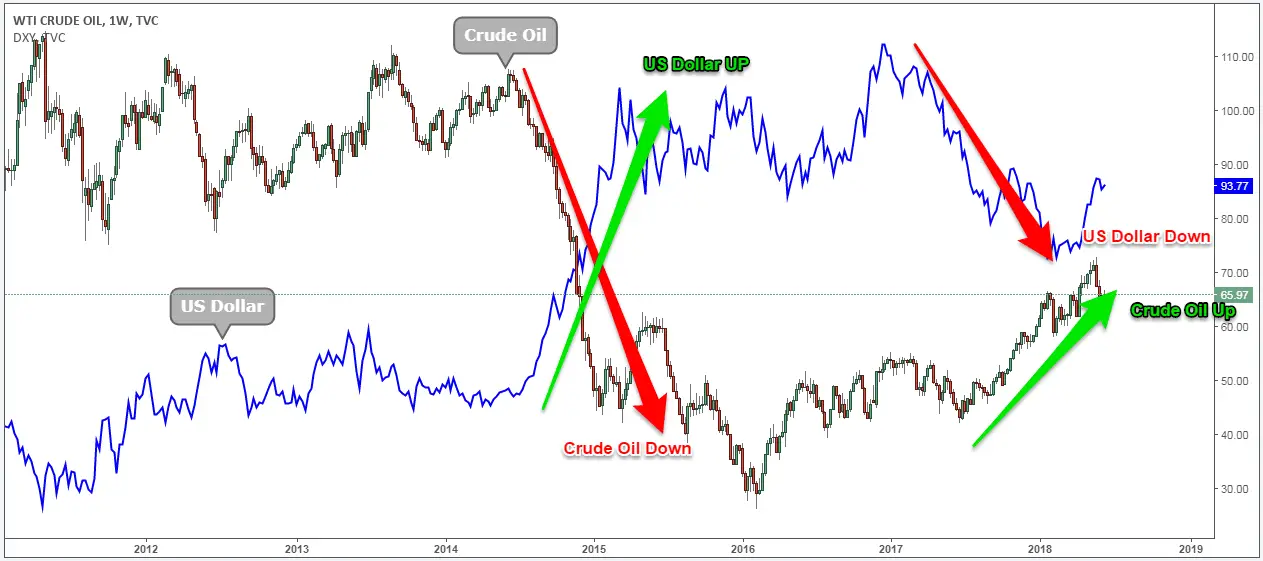
If history can be used as a barometer to forecast Crude Oil prices, we can say the US dollar and Oil have an interesting and perhaps surprising relationship, as they tend to move in opposed directions.
The USD is more closely tied to the price of oil than any other currency. Paying attention to events affecting the value of the dollar can help make the market more predictable.
Things such as announcements from the FED, the introduction of tariffs, changes in interest rates, and other events can all directly the dollar’s overall purchasing power.
Whether you are planning to trade light sweet crude oil or Brent Crude oil, futures contracts trade in 1,000 barrel increments.
The RSI indicator makes it easy to determine when an asset is overbought or oversold, which is useful in commodities markets.
Note*: the preferred Stochastic RSI settings are 20-periods.
The second technical indicator we’re going to use to spot cycles in the commodity market is the CCI indicator.
The CCI indicator was really designed to find cyclical trends in the Oil market and to be used as a bearish or bullish filter.
Note: The preferred CCI settings are 200-periods.
Technically, the best way to interpret the Commodity Channel indicator is as follows. A positive reading above the zero line is a bullish signal and a start of an uptrend, while a negative reading below the zero line is a bearish signal.
As the saying goes, a market can stay in overbought and oversold territory longer than you can remain solvent.

Oil prices are very dynamic. That’s the reason why we don’t want to constrain how much time it needs to stay in overbought territory for a valid trading signal.
However, as a general rule, the Stochastic RSI indicator needs to stay above the 50 line during this time. Preferably, we want to see strong readings in the region of the 80 level.
Not so fast. We’re still not ready to pull the trigger. There are still two more trading conditions that need to be satisfied.
To guard ourselves against the possibility of a false signal, we’ve added the CCI indicator to confirm the Crude Oil cycle.
In this regard, during the time the Stochastic RSI resets, we need to see the CCI holding above the 0 line.
Preferably, we want the CCI indicator to hold above the +100 line.
A CCI reading above the +100 level will ensure a higher probability of the trade to succeed.
Now that Crude Oil price is satisfying these new technical requirements, we can lay down a simple entry strategy to buy Crude Oil.
Step #4: Buy at the market once the Fast Moving Average (Stochastic RSI) crosses below the 20 level.
This Crude Oil entry strategy is easy to implement.
We only need the fast moving average of the Stochastic RSI indicator to cross below the 20 level.
Usually, the blue line is the fast moving average. You can easily identify the fast moving average because it’s the one moving average that it’s in front.
This is a quick trade that enables all traders that took that trade to walk away from the trading screens for the rest of the day.
This brings us to the next important step we need to establish for the best Crude oil trading strategies , which is where to place our protective stop loss.
Once you’ve identified that point on the Crude Oil chart, use it to place your protective stop loss.
Last but not least, we also need to define where we take profits when trading Oil.
Our favorite crude oil exit strategy is to let the trade run until the end of the day or when the CCI indicator drops below the zero line, whichever comes first.
We’re going to incorporate this valuable resource into our exit strategy which is the Commodity Channel Index.
The CCI indicator can spot in advance when an Oil cycle has ended or when a new one has started.
**Note: The above was an example of a BUY trade using our crude oil strategy. Use the same rules for a SELL trade – but in reverse. In the figure below, you can see an actual SELL trade example.
The big trading volume that pours into the Oil market can generate some freakish trading opportunities for the prepared trader.
It’s important to have a commodity trading strategy because no crude oil trading tips can substitute the necessary trading skills you need to survive in the commodity market.
Whether you are trading oil funds with natural gas, WTI, and Brent, or light sweet crude, remember one thing.
You need to exercise a great amount of discipline because the Oil market is infested with the big sharks that want your money.
The Oil supply and demand balances are a critical factor that can alter and change the Oil trend.
In this regard, keeping an eye on the Oil output forecast and consumption outlook can give you an extra edge.
The Oil market is also very sensitive to geopolitical risks.
Keep this in mind when deciding to trade Brent Crude or WTI Crude.
Everything that happens in Iran, or anything that happens in terms of weather in the Gulf of Mexico, will adversely affect the Oil supply output.
Another trading tip is that Oil prices are sensitive to the seasonal pattern. If you get into the seasonal flow of trading Oil, it can be quite rewarding.
The Crude Oil price has the tendency to rise in August due to the summer driving season. It tends to fall towards mid-September and October.
Weather and climate affect changes in oil prices much more than they affect securities such as stocks and bonds.
When there is an unusually cold winter, demand for oil (used for heating) will increase.
Spring and Fall typically see the lowest petroleum values. For cyclical traders, this is often the best opportunity to enter the market.
Crude Oil Price vs the US Dollar
The strength of the dollar is a quick way to gauge the strength of Crude Oil prices.
As a general rule, crude oil prices tend to drop when the US dollar appreciates. Conversely, when the dollar is weaker, crude oil prices tend to strengthen.
If history can be used as a barometer to forecast Crude Oil prices, we can say the US dollar and Oil have an interesting and perhaps surprising relationship, as they tend to move in opposed directions.
The USD is more closely tied to the price of oil than any other currency. Paying attention to events affecting the value of the dollar can help make the market more predictable.
Things such as announcements from the FED, the introduction of tariffs, changes in interest rates, and other events can all directly the dollar’s overall purchasing power.
Whether you are planning to trade light sweet crude oil or Brent Crude oil, futures contracts trade in 1,000 barrel increments.
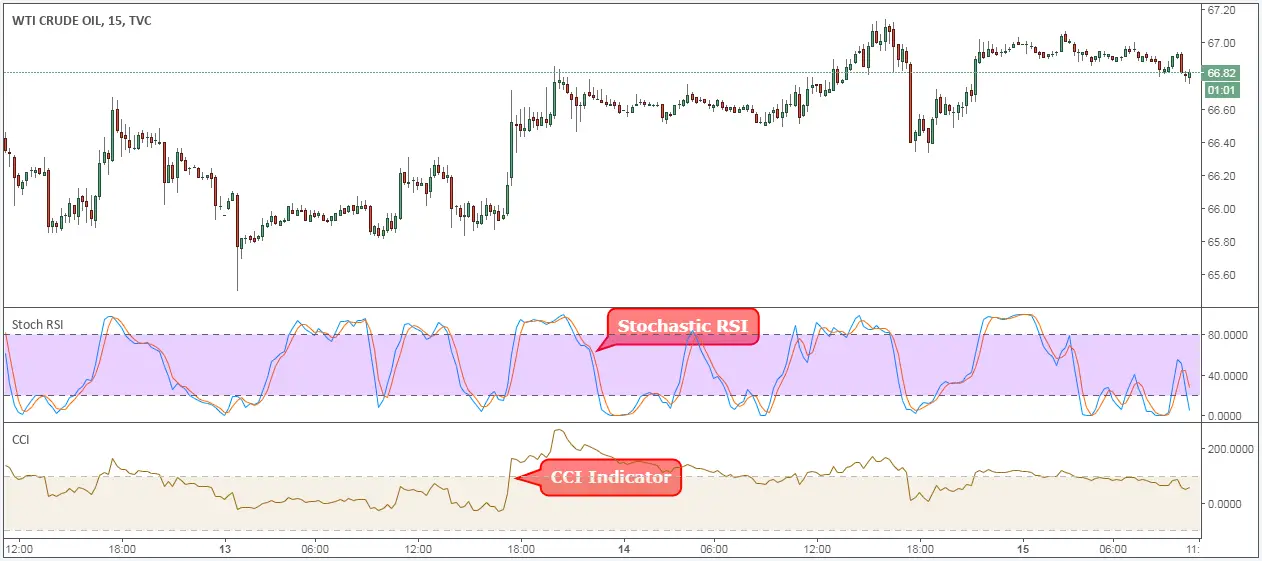
Step #1: Attach the Stochastic RSI indicator and the CCI indicator over the Crude Oil chart.
There are many technical indicators you can choose from. Picking the right one is important if you want to make good trades. The best crude oil day trading indicator is the Stochastic RSI indicator. At least that’s what we found out after trading the Oil market for many years.The RSI indicator makes it easy to determine when an asset is overbought or oversold, which is useful in commodities markets.
Note*: the preferred Stochastic RSI settings are 20-periods.
The second technical indicator we’re going to use to spot cycles in the commodity market is the CCI indicator.
The CCI indicator was really designed to find cyclical trends in the Oil market and to be used as a bearish or bullish filter.
Note: The preferred CCI settings are 200-periods.
Technically, the best way to interpret the Commodity Channel indicator is as follows. A positive reading above the zero line is a bullish signal and a start of an uptrend, while a negative reading below the zero line is a bearish signal.
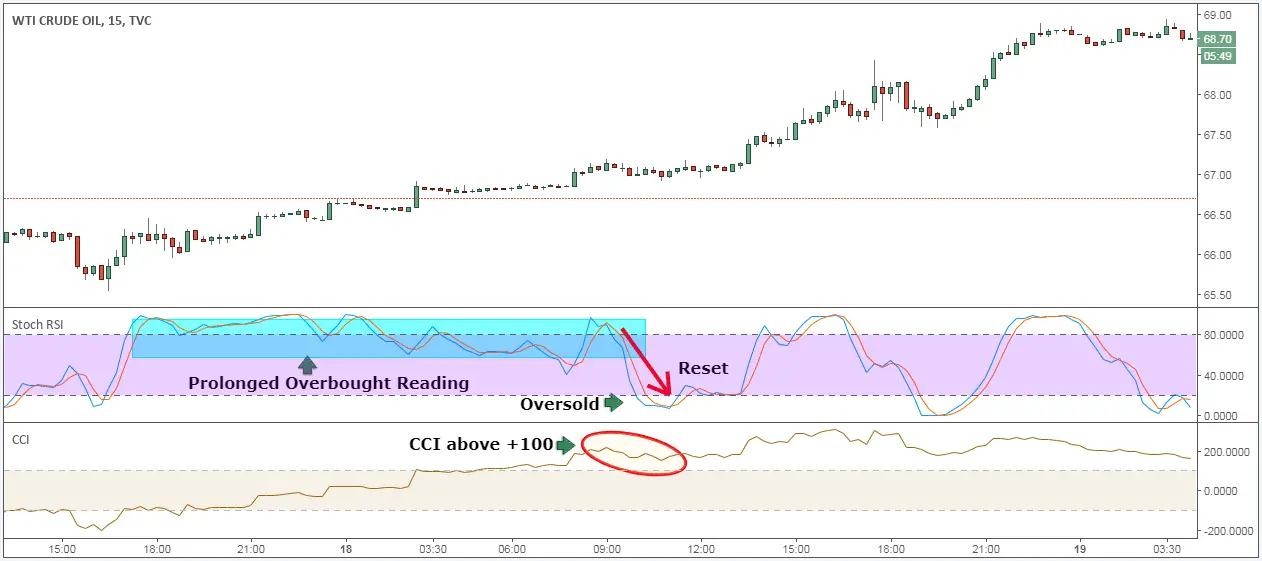
Step #2: Wait until the Stochastic RSI indicator shows an overbought reading for a prolonged period of time.
A good crude oil strategy only looks to buy on strong up days. And contrary to the popular belief, when a market shows an overbought reading for a prolonged period of time, that’s a strong bullish signal.As the saying goes, a market can stay in overbought and oversold territory longer than you can remain solvent.
Oil prices are very dynamic. That’s the reason why we don’t want to constrain how much time it needs to stay in overbought territory for a valid trading signal.
However, as a general rule, the Stochastic RSI indicator needs to stay above the 50 line during this time. Preferably, we want to see strong readings in the region of the 80 level.
Not so fast. We’re still not ready to pull the trigger. There are still two more trading conditions that need to be satisfied.
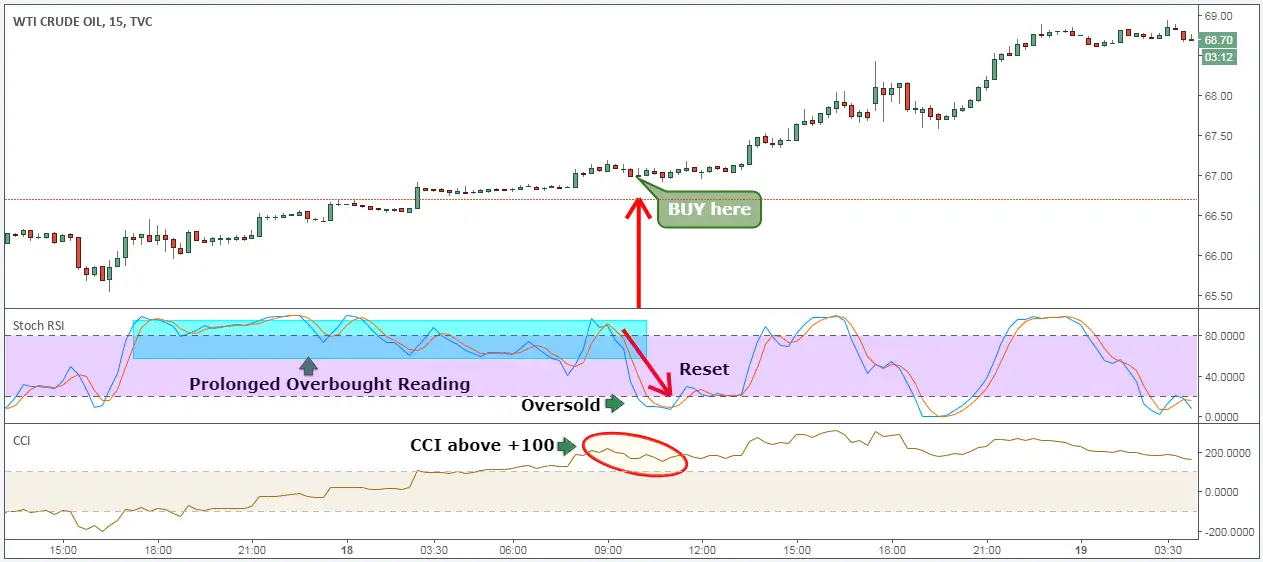
Step #3: Stochastic RSI indicator needs to drop in oversold territory and the CCI indicator needs to show a reading above the 0 line (preferably above the +100 line).
Now that we know that a prolonged overbought reading means we have the smart money buying power, we can assume that once the Oil market reaches oversold reading, the smart money will show up again to keep Oil prices up.To guard ourselves against the possibility of a false signal, we’ve added the CCI indicator to confirm the Crude Oil cycle.
In this regard, during the time the Stochastic RSI resets, we need to see the CCI holding above the 0 line.
Preferably, we want the CCI indicator to hold above the +100 line.
A CCI reading above the +100 level will ensure a higher probability of the trade to succeed.
Now that Crude Oil price is satisfying these new technical requirements, we can lay down a simple entry strategy to buy Crude Oil.
Step #4: Buy at the market once the Fast Moving Average (Stochastic RSI) crosses below the 20 level.
This Crude Oil entry strategy is easy to implement.
We only need the fast moving average of the Stochastic RSI indicator to cross below the 20 level.
Usually, the blue line is the fast moving average. You can easily identify the fast moving average because it’s the one moving average that it’s in front.
This is a quick trade that enables all traders that took that trade to walk away from the trading screens for the rest of the day.
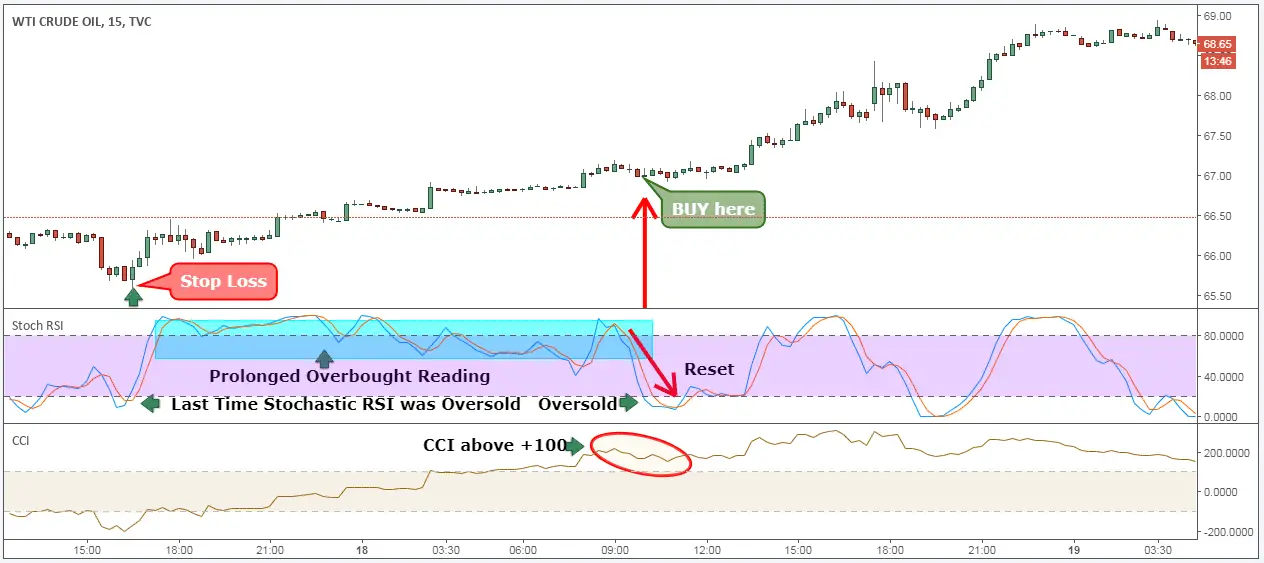
This brings us to the next important step we need to establish for the best Crude oil trading strategies , which is where to place our protective stop loss.
Step #5: Hide your protective Stop Loss below the swing low that corresponds with the previous time the Stochastic RSI indicator was in oversold territory.
Simply identify when was the last time the Stochastic RSI indicator was in oversold territory. Next, locate the corresponding swing low on the price chart.Once you’ve identified that point on the Crude Oil chart, use it to place your protective stop loss.
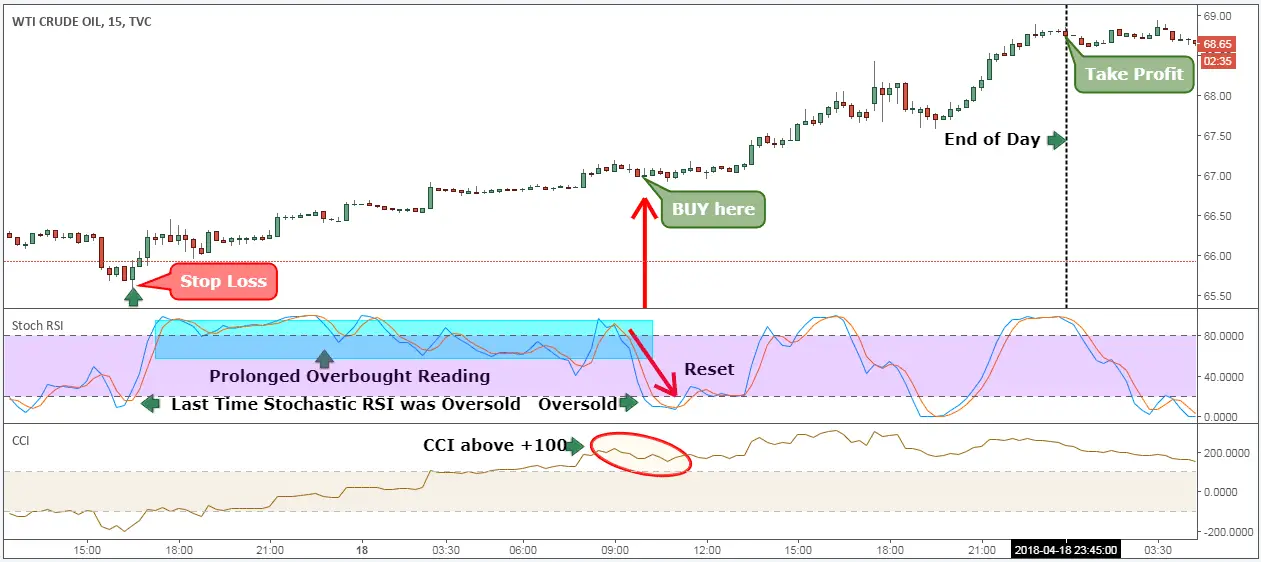
Last but not least, we also need to define where we take profits when trading Oil.
Step #6: Take profit at the end of the day or if the CCI drops below the zero line.
Crude Oil has high volatility and great potential to profit from the intraday trends.Our favorite crude oil exit strategy is to let the trade run until the end of the day or when the CCI indicator drops below the zero line, whichever comes first.
We’re going to incorporate this valuable resource into our exit strategy which is the Commodity Channel Index.
The CCI indicator can spot in advance when an Oil cycle has ended or when a new one has started.
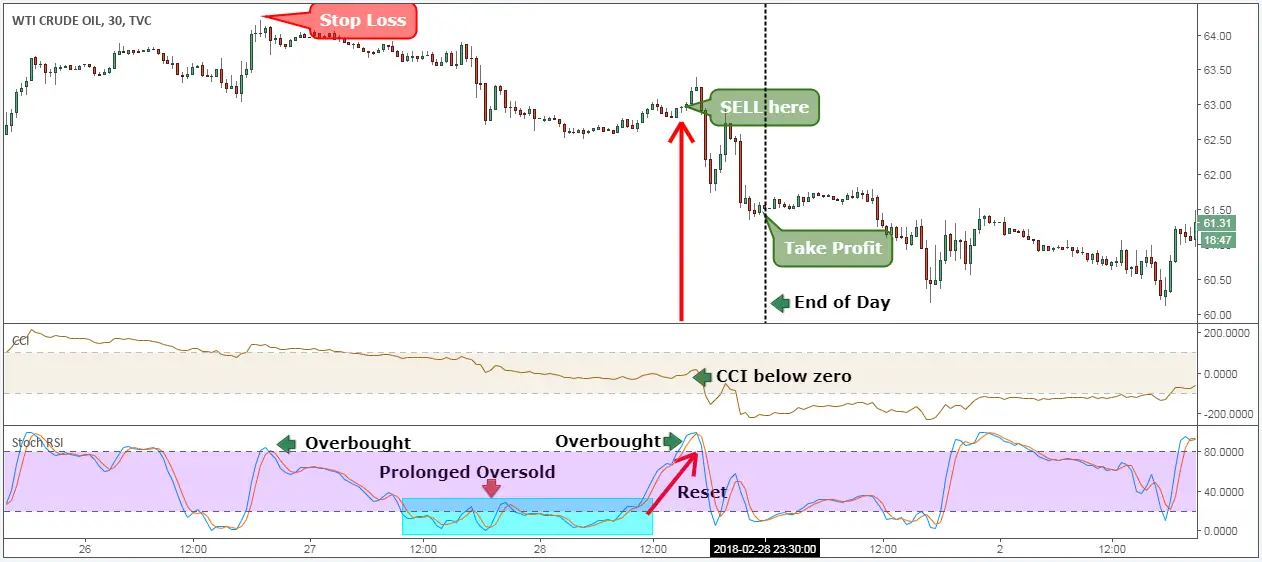
**Note: The above was an example of a BUY trade using our crude oil strategy. Use the same rules for a SELL trade – but in reverse. In the figure below, you can see an actual SELL trade example.
The big trading volume that pours into the Oil market can generate some freakish trading opportunities for the prepared trader.
It’s important to have a commodity trading strategy because no crude oil trading tips can substitute the necessary trading skills you need to survive in the commodity market.
Whether you are trading oil funds with natural gas, WTI, and Brent, or light sweet crude, remember one thing.
You need to exercise a great amount of discipline because the Oil market is infested with the big sharks that want your money.


Post a Comment