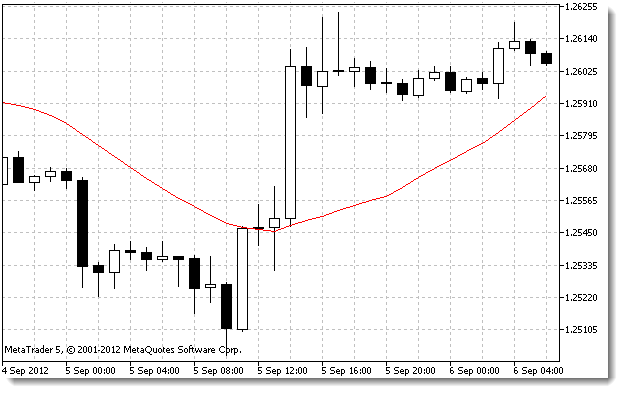
Indicators are small programs written in MQL that are displayed in the price chart or in a separate window below the price chart and enable us to perform technical analysis of the market.
All indicators can be classified into two types: trend-following indicators and oscillators.
Trend-following indicators are, as a rule, drawn in the price chart and are used to identify the trend direction, while oscillators can normally be seen below the price chart and serve to identify entry points.
Most indicators have at least one buffer (indicator buffer) that contains its reading data at a given time. Like an EA, the indicator has its symbol and time frame on which it is calculated.
Indicator buffer can be considered as a queue the last element of which is a running value.

Example of the Moving Average Indicator
Indicator buffer is an array where the first element (with 0 index) carries data on the rightmost candlestick and the following element (with index 1) carries data on the second candlestick on the right, etc. Such arrangement of elements is called time series.
Take a look at the example as follows:
Assume the currency pair we have is EUR/USD, time frame is 1 hour.
First off, we need to add the indicator to the EA and get its handle.
Handle is a unique pointer to the indicator that enables us to address that indicator anywhere in the program.
int iMA_handle;
iMA_handle=iMA("EURUSD",PERIOD_H1,10,0,MODE_SMA,PRICE_CLOSE);
Let us look at it closer.
The first line defines a variable that is going to store the indicator handle. The second line calls the indicator (here, the Moving Average indicator), specifies its parameters and saves the handle into the variable for future use.
After typing "iMA(" in MetaEditor, a tooltip will appear above that line showing comma separated indicator call parameters.

Fig. 4. Example of the tooltip for the Moving Average indicator parameters
We can see the following parameters listed from left to right:
- symbol name (appears in bold letters in the tooltip) is a text parameter, currency pair (symbol);
- time frame;
- indicator period (here, the averaging period);
- chart shift by N bars forward/backward. A positive number denotes the chart shift by N bars forward, whereas a negative number denotes the chart shift by N bars backward;
- averaging method;
- price applied or a handle of a different indicator.
There is a unique set of variables and their types for every indicator. If you come across an unknown indicator, the information on it can always be found in the built-in context Help. For example, once you have typed iMA and pressed F1, a Help window will open providing information on that specific indicator and a detailed description of all its properties.

Example of calling the Help window for the description of the indicator by pressing F1
After writing the code and starting the EA in the terminal, we will see (once the EA appears in the top right corner of the price chart) that the indicator is missing from the chart. This is not an error - it was so intended. In order for it appear, we need to add another line:
ChartIndicatorAdd(ChartID(),0,iMA_handle);
Let us now see what it does. Hover the cursor over the ChartIndicatorAdd command and press F1 to read the Help information on the purpose of the command. It says that this command:
Adds an indicator with the specified handle into a specified chart window.
The second parameter which is equal to zero is the subwindow number. Subwindows usually contain oscillators, below the price chart. Remember? There can be a lot of them. To display the indicator in the subwindow, you only need to specify the subwindow number so that it is greater than the already existing number by 1, i.e. the number following the last existing one.
Having changed the code line as follows:
ChartIndicatorAdd(ChartID(),1,iMA_handle);
our indicator will appear in the subwindow below the price chart.
Now it is time to try to get some data from the indicator. For this purpose, we declare a dynamic array, arrange array indexing as time series for the sake of convenience and copy indicator values into this array.
double iMA_buf[];
ArraySetAsSeries(iMA_buf,true);
CopyBuffer(iMA_handle,0,0,3,iMA_buf);
The above example shows that we have declared the dynamic array iMA_buf[] of double type as the Moving Average indicator is based on prices and prices have fractions.
The next line sets the indexing for the array so that the elements with smaller indices store older values, while the elements with greater indices store more recent values. This is used for convenience to avoid confusion as indicator buffers in all indicators are indexed as time series.
The last line serves to copy the indicator values into the iMA_buf[] array. These data are now ready to be used.


Post a Comment