
Forex Position Trading Strategy: Don’t Stress Out About Normal Volatility
Now that you are familiar with some of the fundamental factors that can influence a long-term trading position, we will now try to provide some concrete positiontrading tips that will help you to make better, more informed decisions.
1) Reference Major Economic Data
Base your long-term forecast on major fundamental and macroeconomic data. Confirm your fundamental research with technical chart analysis. Monitor geo-political events to discover vulnerable political models and weakening economies that may provide for a long term tradeable opportunity.
Always try to support the economic events and your long-term fundamental outlook with a technical indication on the chart. Is there an emerging trend based on the ADX indicator or a trend line breakout?
Is there a breakout from a horizontal support/resistance level? Is there a consolidation chart pattern that may lead to a volatility expansion? These are the types of questions you need to ask yourself so that you are timing your entries efficiently. Remember, in the markets it is not enough to be right, but rather you need to be right at the right time.
2) Use Daily and Weekly Charts
As we have previously touched on, you should focus your attention on bigger time frame charts when position trading. The most appropriate charts for position trading are the Daily chart and the weekly chart. With the daily chart, you can typically visualize a period of a few months up to one year, while on the weekly chart you can typically visualize one to five years of price action.
Make sure you are using the same time horizon for your entries and exits. This may seem obvious but the trap that some traders get into is that they will take a long-term position trade based on a weekly chart setup, which should likely run for a few months, but then the trader drops down to a 240-minute chart and finds an opposing signal and exits the trade within a few days.
So essentially the trader is taking an entry at the position trading time horizon, but they are knowingly or unknowingly, exiting at the swing trading timeframe. You need to be careful to avoid falling into this all too common trap.
3) Don’t Stress Out About Normal Volatility
When you have a trend on the price chart, it is normal that some of the price interactions within the trend do not line up or touch a trend line exactly. There may be some false breaks along the way. This is quite normal.
One of the best ways to handle this is to change the current chart setting from a bar or candlestick chart to a line chart, and plot a trend line using the line chart. The reason that this works well is because a line chart is based on closing prices so many price spikes and market related noise on the chart can be greatly reduced.
4) Look for Strong Breakout Confirmations
Rather than entering into a trade immediately after a breakout, it is advisable to wait for additional price development when confirming breakouts – regardless of whether the breakout occurs from a trend line horizontal zone, or chart formation.
When the price breaks a level on the chart, you should try to be patient and let the initial price extension play out. Then you are likely to see a return and retest of that level. For example, if the price breaks a support downward, it will likely be tested as a new resistance. Then after the retest if the price breaks the swing bottom created after the initial breakout, you will have sufficient reason to short the market with a highly favorable risk to reward scenario.
5) Watch the 50, 100, and 200 Period Moving Averages
There are a few key moving averages that a position trader should keep a keen eye on. I suggest that you monitor the following 4 moving averages – the 50, 100, 200, and even the 500-period Moving Averages.
These are the most widely followed and psychologically impactful moving averages that big institutions tend to monitor. Also keep in mind that there are multiple variations of moving averages in terms of its calculation, but I have found that the Simple Moving Average version works as well as any other.
Now let’s take a look at an example of a long term position to demonstrate the power of this trading approach.
An example of a major recent political event was the Russian intervention in Ukraine. Ever since Russia invaded and added the Crimean Peninsula to its territory, it has been suffering the sanctions of the European Union providing an unpleasant economic situation in the country.
The European Union enforced economic sanctions on Russia in July 2014, and then it reinforced the sanctions in September 2014. This had a huge impact on the Russian Ruble.
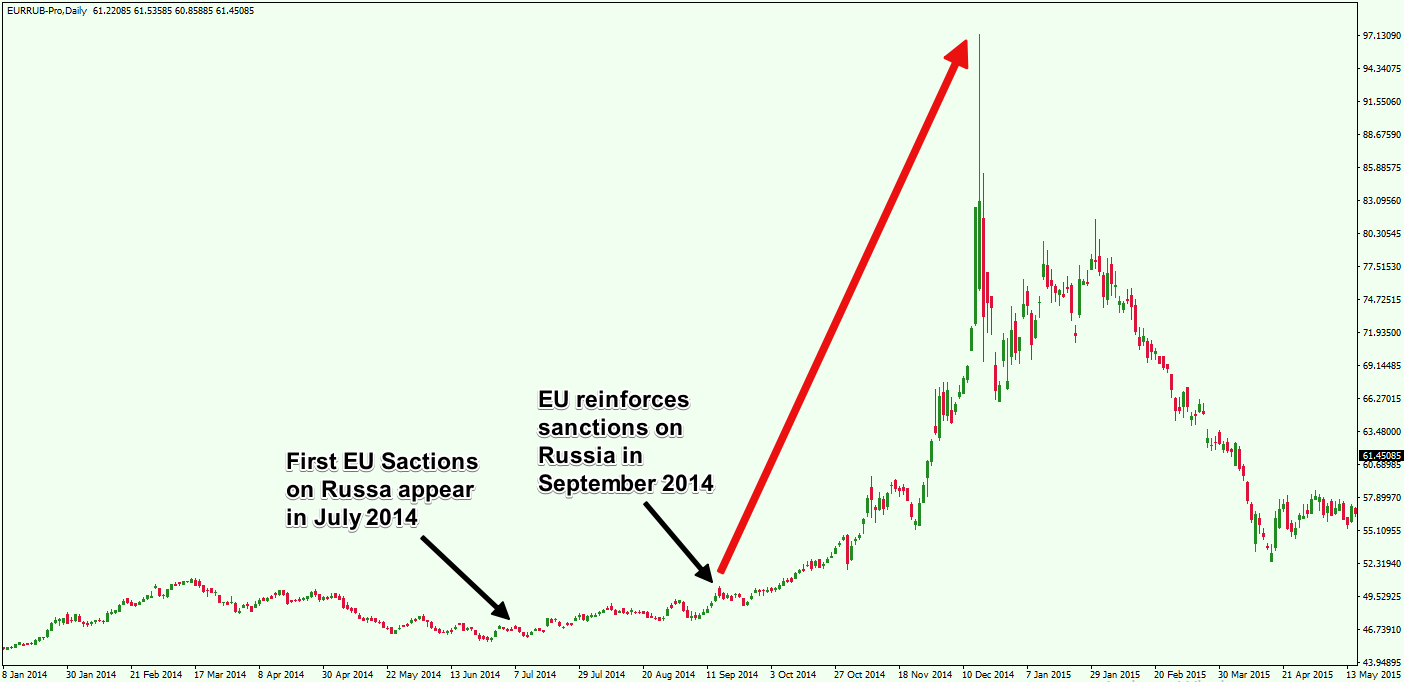
Above you see the daily chart of the EUR/RUB Forex pair showing the EU sanctions impact on the Russian Ruble. The Ruble depreciated approximately 50% versus the Euro currency.
This situation provided a very attractive opportunity for the long term forex position trader. Let’s see how you could have taken advantage of the EU sanctions on Russia:
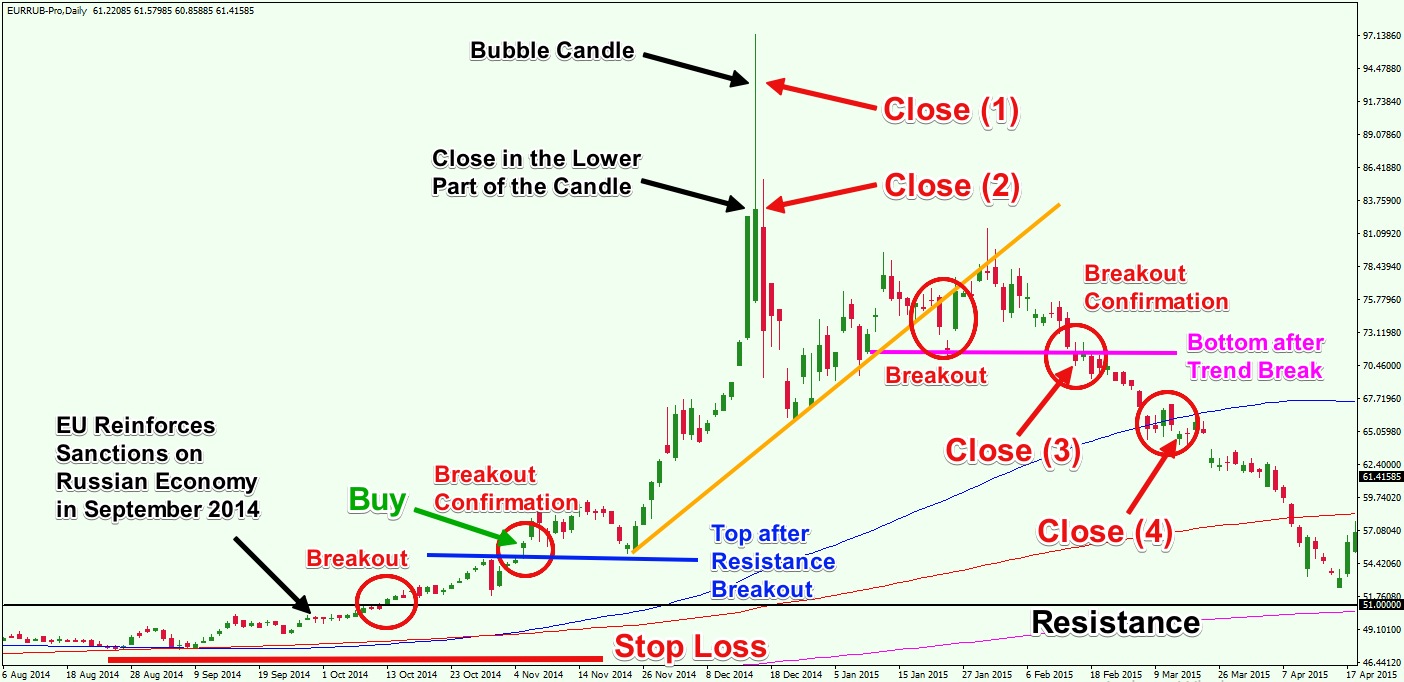
This is the zoomed in version of the previous chart. After the EU reinforces sanctions on Russia, the EUR/RUB Forex pair breaks the 51.00 resistance level that marks the last big top from the middle of March 2014 – when Russia took over the Crimea Peninsula. This happens right after the price action has already crossed above the 100, 200, and 500 Simple Moving Averages.
After the 51.00 resistance breakout, the EUR/RUB set a top in the 55.00 area (blue horizontal line). The price then returned to the already broken 51.00 area for a support test. After a bounce, the blue horizontal line gets broken upward,creating a confirmation for the previous bullish breakout through the 51.00 resistance.
Before moving further, let’s understand what the thought process is. After a bearish fundamental event for the Ruble (the EU sanctions reinforcement), you are now getting a bullish technical signal for the EUR/RUB, which confirms the bullish long term position trade. Our negative fundamental outlook for the Ruble, was reinforced with a technically timed trading signal.
Therefore, you can use this opportunity to buy the EUR/RUB Forex pair at 56.00 Rubles for one Euro, on the assumption that the Ruble will depreciate further. Your stop loss order should go below an important swing bottom on the chart as shown on the image.
Now let’s fast forward a couple of months. The price action touches the area around 97.00 Rubles for one Euro, which is 40.00 Rubles more than your entry price. Notice that at the top of the price increase, there is a candle that demonstrates a bubble price behavior due to extremely high volatility. Then we see that the respective candle closes relatively low, creating a huge upper candlewick. Now, this is an indication that the bullish move may be ending.
You should use this extremely high volatility blow off candle to exit a portion of your trade or close it out entirely at this point.
You may not consider this as a smart move from a fundamental stance, since the political and the economic situation in Russia had not shown any signs that the situation would improve in any significant way.
Based on your fundamental assessment, if you do not believe that this is the end of the price increase, you can wait for a valid breakout through the orange bullish trend. As you see, the price action creates a bearish break through the orange trend, setting a bottom near 71.00. You can use the price break at the bottom at 71.00 to exit your trade.
The later closing opportunity on the chart comes when the price action breaks the blue 100-period SMA in the bearish direction. There was plenty of evidence to lighten up your position or completely close your trade prior to this, but with this technical event, you would certainly want to flatten your remaining positions.


Post a Comment