
Category Analysis charts - Price Action - Part 1: Reading Japanese candlestick pattern
Hello Trader!
Technical analysis is an indispensable tool in Forex Trading profession, of course it is not absolutely accurate but certainly much help in identifying trends, finding and exit points as well as a reasonable command early identification signs of reversal. Forex Chart Forum is about 2 parts: MODEL MODEL PRICE and CANDLESUpdate!A phenomenon Candles "leapfrogging" - From expert called GAP, the application to identify a strong resistance level. See details here >>

The most basic things before reading charts
Like learning to read words, we first need to identify each item of letters, then merge the text into words and sentences to understand the meaning of sentences. Read the chart price is the same price chart, it is necessary to know the most basic things such as Japanese candlesticks, ..1. timeframe timeframe

On the chart of MT4 trading software, there are many different timeframes from 1 minute to 1 month, on Chart 30 minutes, then every 30 minutes passed would end a candle. Me is to use candlestick charts see Candelstick then, charts cord or other type, then do not watch it. Currently most of the people were using Japanese candlestick patterns to analyze this or that clearance (described later)
2. Understand the structure of a candle
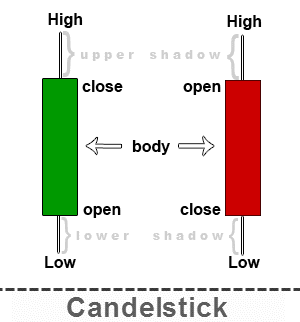 This is the shape of a Japanese candle, if at first you look at the price chart you must have not Understand u float some candles mean and how to read each of its constituents. Actually very simple, see the photo on the right =>
 For the price candle UP Open the first opening price, closing price Close the candle end, the Body is the length of the candle. Similarly for candles decreased (red).
Low and High called shadow, a shadow on the remaining High Low is lower shadow. Regardless correct this shadow to determine the clearance rate (Support and Resistance is generated by the models candle)
Several farmer often look to the sky for weather forecast, while the Trader is looking at the tree, "candle god" or Model Price Price Action to predict future developments.
3. The special candle patterns to predict trends
The table below lists some special Japanese candlestick patterns, they more important than usual because the candle patterns based on the shape may know the momentum of Trader group BUY, SELL - dominant groups, groups are exhausted ...| Description form Candles | Photo realistic |
 Doji candle Candles are popular Japanese model, this is a sign that a rally prepared occur because buying / selling is gradually exhausted. Example: In an uptrend, at a temporary peak with a Doji, the ability to have peak, SELL opportunity came.
The Trader often incorporate additional tools other indicators or price
model Price Action, not just rely on each tree candles for trading
decisions, so Doji is just one piece of the picture reversed. Doji candle Candles are popular Japanese model, this is a sign that a rally prepared occur because buying / selling is gradually exhausted. Example: In an uptrend, at a temporary peak with a Doji, the ability to have peak, SELL opportunity came.
The Trader often incorporate additional tools other indicators or price
model Price Action, not just rely on each tree candles for trading
decisions, so Doji is just one piece of the picture reversed. Also, Doji also serves as validation tool followed previous candle. Tip: If Doji appears in the block level (eg clearance from Trendline, price channel Channel, fibonacci retracement, pivot points .... ), then acted as shadow makes "psychological" resistance increases terrible. |  |
 If you are keeping order Buy, this is the time to take profits lest diminishing returns. |  |
 |  |
 | |
 |  |
 Yes Body short and long shadows, at least twice as long as candlesticks. Long shadows are slowly showing SELL team dominates, followed by tree Shooting is reducing the chances Selling candles arrived, Stop Loss above shadow. |  |
 |  |
>>Technical analysis with Pivot Point
>>Technical analysis with cell lines Moving Average avarage - MA - SMA - EMA
>>Guide to making money on YouTube
>>NEW!the long awaited eToro trading update for 2015!
source:kinhdoanhforex


Post a Comment