
Introduction to FOREX:Technical analysis
After installing MT4 Platform and create a Virtual Trading Account (Demo)
This is interfaces Mt4 Platform, regional manager and account management tools Technical boarding is arranged as follows:
1 / Table rates: Right-click the table and choose the exchange rate "Show All" will display all the FOREX pair and GOLD (XAUSD, XAUEUR, ..)
2 / Indicator: Regional additions support tools Technical Analysis.
3 / Management transactions : Here, Trader can track order transactions are executed, close the transaction , see the results of transactions , ...
PART I: WHAT IS TECHNICAL ANALYSIS?
Technical analysis is nothing but manipulation of price volatility observed in the past to predict the next move of the market. Can
understand simple, the Trader should identify the main trend of the
market to surf under waves [the priority upturn buy and vice verse
PART II: DETERMINATION OF TRENDS
Always remember that the "Trend is your best Friend", going against the trend is no different than swimming upstream data mine. Most uncle Newbie (including me) and early budding bi knockout mixed by raising command. In 2009, the market trend breaks Gold rose from 95x up to 1000 USD / ounce. Many
still hold specific positions when the recession, the global crisis is
resolved, the Gold will return true value (Around the cycle at 500 USD /
ounce)

Well, preserving capital is the leading rule for the Professional Trader. No one can predict with 100% accuracy of market developments in the future. We only admitted on probability.
This is the boundary between Trading- Betting
When gambling, for example:
+ Game 3 Scratch-way call in southern >>> Pineapple Beach. When there are 10 "gambler", the probability that you "gather up" package only 10%.
+ The (B lost with dealers), the maximum probability of winning is 50%
....

When putting money into gambling as above, then you are the mercy .
For transaction - Trading sector , on the other , The Professional Trader does not depend on the bad luck of chance . A Winner is who can accurately predict more than 50 % market movements .
The only way to do that is to develop appropriate rules for trading with themselves :
A market assessment system to identify trading opportunities in my opinion should converge two factors:
+ Consistency: Hundred battle as one, share one or several causes. Avoid adding too much of the Indicator in a chart leading to distraction.
+ Consistency: Prior to the "floor" trade real money, should spend at least 3 months of serious trade on a virtual account (Demo) The objective is to develop guidelines dealing with the probability of 70%, it can manoeuvre Horizontal Vertical then ^^
Method of determining the trend of the ranges are based on momentum and RSI Moving average. RSI
momentum is relatively complex concept, so I will post detailed
instructions on this subject [You can refer to this secret stuff here: [ Momentum RSI]
MANUAL RANGE MOVING average to confirm the trend:
"Sugar is sugar MA plotted without prices fluctuate daily.
Its primary benefit is to help you identify the trend (trend) in the past of the chart. But
if you take the time to learn and analyse MA clear, it will give you a
lot of valuable information, help you estimate when to buy, hold and
sell stocks.
You should be aware of the methods of calculation MA to use it effectively.
The simplest is a simple moving average calculated (Arithmetic or Simple Moving Average Moving Average). This
type of calculation is the total price of the shares over a period of
time each day and divide them up according to the following formula:
p = price = price, usually the closing price; price fixing, but they also can charge the highest rates (+ high), lowest (+ low), or at the opening (open) of the day.
n = period = a purchasing stage, usually every day
Because
of this change moving average data for each session, leaving the price
the first day, more on the last day so people also called the moving
average is modified or mobile averages (Moving Average).
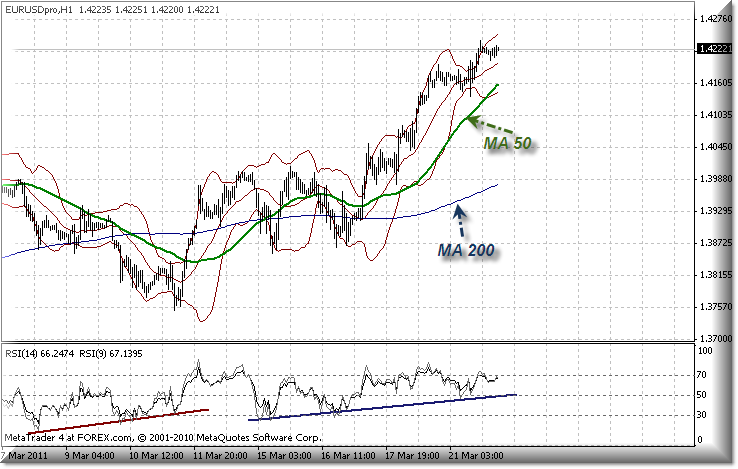
Using MA: The following excerpt on how to identify trends with ranges MA (Applies to all products traded. Particularly FOREX market, I use the MA 200 and MA 50 on 1H chart to operate use of the theory:
Optimal
Usage of MA is not recorded fluctuations daily aliasing which creates a
path to your almost straight path to identify trends in the past prices
as soon as you see the chart.
If
operators want to buy or sell securities MA, we must accept the
hypothesis is not always true that MA is the strike price of the company
because it is a moving average of the high and low range.
People use the MA 200 for long-term purchases, MA 50 to know the trend of trade at a relative time. And MA 5, MA 13 is a priority for the person who wants to purchase in a very short time, type of swing or day trading.
Under
normal rules, when that price is moving higher, you should buy for my
MA for signs stock average rising more thought, investors faction
believes in this and its shares are up. MA can see the road Support.
The
drawing above shows you that you should 5 cases buying and if you've
already bought, you should continue to wait for the stock to continue
because the shares were changing trends, there are many opportunities to
go up than to go down:
1)
After MA (black dotted line) go down for a while, it horizontal
deflection that road pricing (bold black line) regularly to MA. Shares bucked the trend, rose after a period of falling prices.
2) Road pricing when moving through both tend to go up. Shares speed, rose more than usual.
3) When sugar prices fell, touching but not penetrate the MA. Shares reduced speed, but also light, almost negligible.
4) When sugar prices through moving, but moving still clear upward trend. Shares reduced speed, but overall, it's still an upward trend.
5) When sugar prices fall too far from the MA. Shares are oversold, become scarce and people want to sell into those who want to buy, can reverse that, climb back to MA. But this case is quite dangerous because of stock trading that says: Do not shoot a knife when it is dropped. Whatever
the final application of this technique more profitable in other ways,
but we encourage the new apprentice who trade equities do not use this
technique to work Thursday on a mission. You must combine a variety of analytical techniques, information and personal experiences are held much hope the victory.
Conversely, when prices drop below the moving average, we should sell out, sell part or sell presale form after (short). Now moving to one sign that stocks are down, schools lose trust and investment risk down further still. Prices are falling than average but not know where it fell to. MA may see as road Resistance.
The
map below gives you five signs that you should sell out or short sales
for all remaining shares upward trend that began falling.
1) After a period of ascent, moving the horizontal deflection. Sugar prices are moving regularly down. The chart shows the price has been leveled and are dropped.
2) When you go down that road moving through the price still moving. This is the state of stocks fell very quickly.
3) When sugar prices are touching but not through MA., Shares hit resistance line which does not pass.
4) When sugar prices through moving but moving averages are still trending down.
5)
If the share price moving up too far, people recommend sale because
shares can manually adjust the share price drop, you will lose the
opportunity to sell it when it is at its highest level. But we think that you should not sell stop loss order should be placed close to the listed price. If
shares manually adjust your stake is still being sold, you may lose a
little profit but if it is to continue, it is still a chance for you to
proliferate more money. And another way is to sell part of shares, taking money out and root for the remaining shares as part .- BOLTS INSTRUCTIONS FOR PARTIAL WORD
Example: Buy 100 lots GOLD, when the market goes well and you want to profit 1/2 volume = sell 50 lots is carried out as follows:
Click-click the command is executed, in the column "Volume" to liquidate selected volume, then click the button "Close # ...."


Post a Comment